K-means clustering is used in data mining to analyze clusters. Method divides n observations into k clusters, deciding by distance from nearest mean. It tries to find centers of natural clusters in data by iterative improvement. After defining all clusters, clustering new element injected to dataset is just matter of computing all distances from means and choosing the nearest one. That will be the cluster for newly added object.
Clustering algorithm consist of these steps:
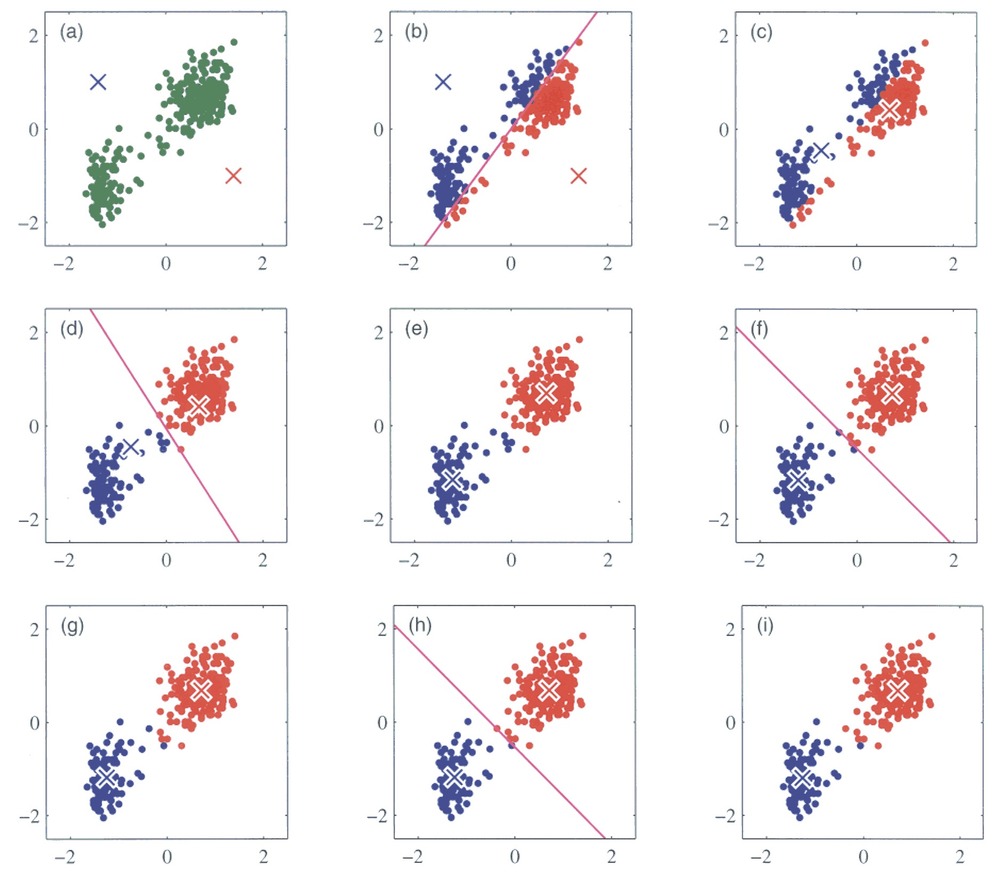
In initialization (a), all means (in our Figure just two, represented with crosses) are randomly selected from data set. Currently we are using two dimensional Euclidian space, but similar process can be performed in n-dimensional data set, only difference is the distance function to determine positions between each object in n- dimensional space. In next step (b), whole data is assigned into clusters depending on which cluster center is nearest. After division, each cluster center is re-computed to be the mean of the points assigned to the corresponding cluster (c). (d)-(h) shows iterative improvement of cluster centers. Algorithm slowly converges into state (i), where cluster means are stable and are no more changing. These are chosen as representative, and clusters are selected accordingly. (based on [Bishop 2006])
Even thou algorithm is used to divide data set into clusters, these means can be used for further processing when new object occurs in dataset. At that time, when means are chosen, no more re-computation is performed, new object is clustered accordingly and added to specific cluster. Selected cluster is then chosen as object evaluation.
Evaluation process
Evaluation with K-Means is straightforward. Assuming there are etalons provided, classifying another vector is just computation of the distance from each etalon and determining the nearest one. Imagine having not one, but set of etalons for each class. this way, each class can be represented much more specific. This approach is mainly used, when one mean value would not cover class states (red or green) effectively as seen below:
By adding set of means for one class, these can be represented in much more detailed structure as seen below:
now, green or red class is represented not by one, but by 5 mean values, that cover their part of the states (red/green dots).
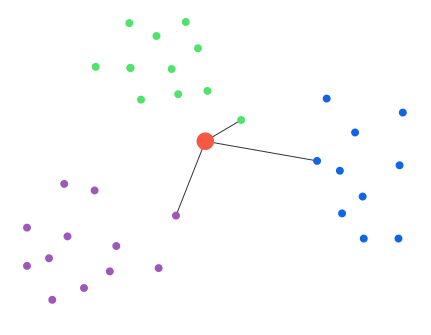
In evaluation process, when clustering new object (big red dot at picture below), nearest distance from each set of etalons is chosen as representative distance from class. Class with shortest distance is evaluated as cluster for this new object (in our case green class).


