While working on a IBM BPM project, i was really frustrated with debugging option Process Designer offered. It was really messy to look through the XML output every time i was searching for desired variable. This made me wonder why it does not offer eclipse based debugging options, when whole Process Designer is based on it. Because i was using older version 7.5, i automatically assumed in latest version this will be taken care of. For my surprise, while on a workshop about latest version of IBM BPM, i discovered, this debugging did not changed at all. That was the time i decided to create my own debugging tool to help myself.
Mozilla add-on was my first choice, because it seemed that it is easy to write. I have never written an add-on before. To save some time i found javascript code to parse xml into objects (i was searching for the article and author, but the site is now down…). I ended up changing most of the code to better fit my needs anyway…
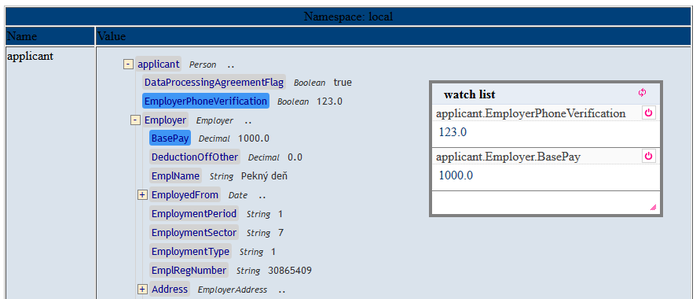
More interesting feature is added “”watch list” window where one can drag and drop attributes and it will keep them for the whole session.
Using jQuery i made everything drag-able, drop-able and resizable.
go try out BPM Debug Helper yourself
https://addons.mozilla.org/en-US/firefox/addon/ibm-bpm-debug-helper/
Right now it has a performance issue… it is slow and with really big data it can freeze and crash javascript, but for small set it works just fine.
Please let me know if this is useful at all, and what except fixing the performance should i add next.
If it does not work properly let me know here and we can work something out.